The rate of return on plan assets is not an input parameter in the Pension Insurance Modeling System (PIMS), but rather depends on assumptions affecting projected interest rates and stock and bond returns and on assumptions about how plans allocate their funds to asset categories. The projected variables that determine asset returns also affect other important outcomes in the models, such as sponsors' bankruptcy risks, inflation and the growth of participants' salaries and benefit levels.
One way to look at the sensitivities of projected outcomes to plan returns, while capturing all the associated effects of related variables, is to look at how the outcomes vary with the randomly simulated rates of return that are projected with the current model.
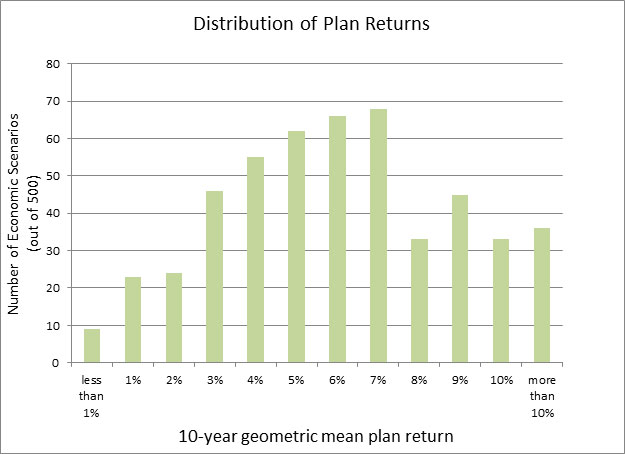
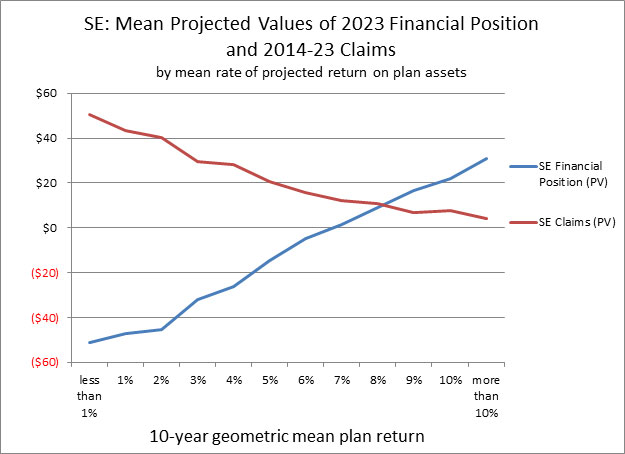
PIMS simulates 500 economic scenarios, with each scenario having a different path of plan returns. To produce the chart below, we calculated the 10-year geometric mean of plan returns for each scenario and rounded to the nearest percentage point. For each value of rounded plan returns, the chart below shows the mean projected single-employer (SE) values, from the matching scenarios, of the present value of PBGC's 2023 SE Financial Position and the present value of SE claims over 2014-23.
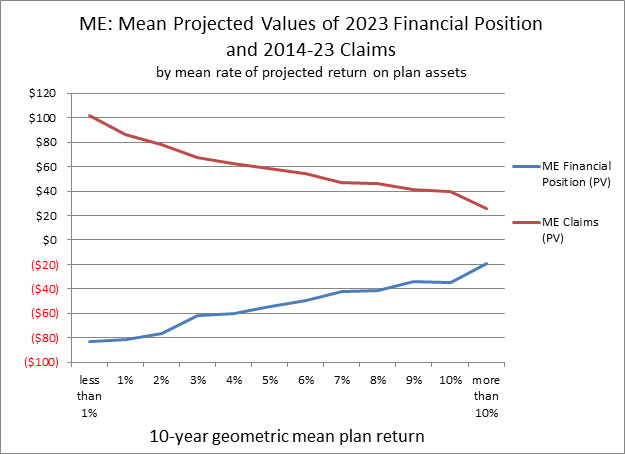
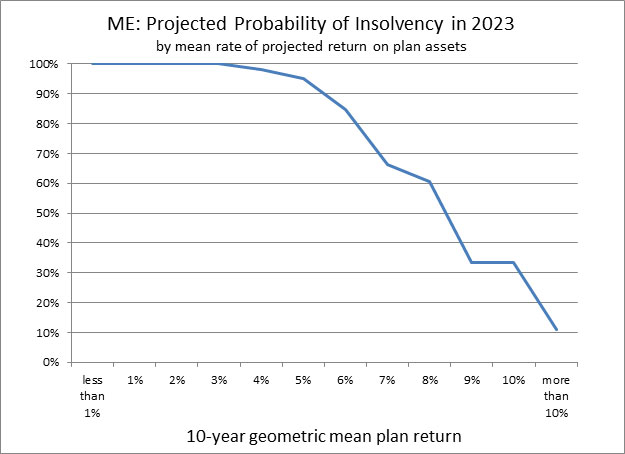
The following charts show: 1) the same values as above, but for projected multiemployer (ME) outcomes, and 2) the relationship between projected plan returns and the probability of the ME program's insolvency in 2023.
The final chart shows the frequency distribution for the different levels of plan returns across the 500 economic scenarios (the SE and ME models use the same plan return projections).