
Background
The Multiemployer Pension Insurance Modeling System (ME-PIMS) stochastically projects future changes to plans' active participant populations. The modeling is based on an assumption that annual proportional changes in each plan's population depend on a constant term, the prior year's change and a random disturbance. That is,
∆ln(Nt) = α + βΔln(Nt-1) + εt,
where Nt represents the number of active participants in year t. The random disturbances affecting participant changes, represented by εt, are modeled to be correlated with the random disturbances used in projecting future bond yields and stock returns.
Prior practice has been to assume a zero value for the constant term affecting population change, thus implying the median projection of active participants will remain level. One of the recommendations from Buck Consultants' review of ME-PIMS was that this level-median assumption might be modified to reflect the trend of declining multiemployer participation that can be observed in recent years.
The approach taken in modeling this update has been to leave intact the current structure of the model, but to estimate new model parameters that will reflect the trend of decreasing participation.
Data overview
Data on multiemployer participation levels was taken from Form 5500 and Schedule B/MB filings for plan years covering 1991-2011. For analysis purposes, a large number of observations of plan filing data were excluded. Reasons an observation might be excluded are:
- Insufficient length of uninterrupted history – the model relates one year's annual change in participation to the previous year's change. A single observation of this relationship requires three consecutive years of participant values.
- Size threshold – very small plans tend to have significantly higher levels of volatility and more data quality problems. Since large plans are most important to the ME-PIMS projections, the analysis eliminates plans that have never (within the data window) had at least 500 active participants.
- Extreme changes in number of participants – the following chart shows the distribution across plans of annual changes in participant counts for the data sample (after the other exclusions have been applied). About 70% of the observations are within the +/- 10% range. However there are a significant number of observations having much larger changes to the populations. Many of those observations are not appropriate to include in this modeling for the following reasons:
- Mass Withdrawals – ME-PIMS has a separate portion of the model that projects mass withdrawals. If the annual change portion of the model was also reflecting changes due to mass withdrawal, the overall model would effectively be double-counting mass withdrawal effects.
- Spinoffs and Mergers – large changes in number of participants can be caused by plan spin- offs or mergers. In such cases, changes to the number of participants in the original plans do not reflect changes to the number of participants covered by PBGC insurance; they are just transfers of participants from some plans to others. ME-PIMS does not project future spinoffs and mergers, so capturing volatility due to those activities would inaccurately result in projections of new hires or layoffs. Instead those observations should be excluded.
- Data Quality Problems – Many extreme values are simply due to erroneous data. Some such observations have been identified through inspection of the data, but there are too many observations to thoroughly check each one (and for data from older filings, source documents that would be aid in checking are not available).
To control for unwanted data, observations are excluded where the change in number of active participants was outside the +/- 30% range (in either the current year or the previous year).
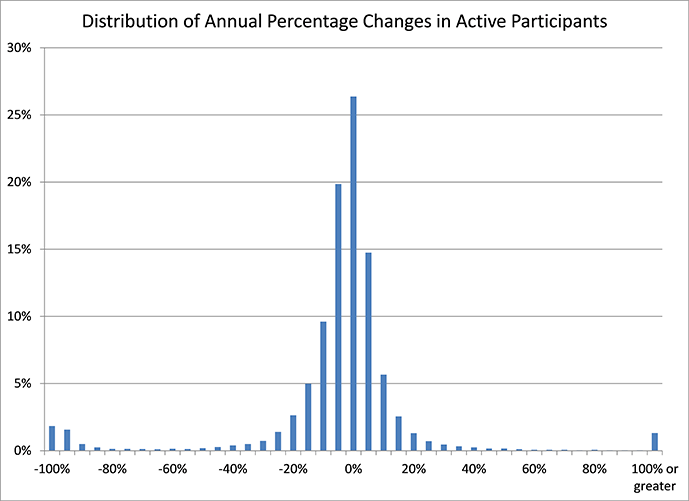
Given the above data restrictions, the average annual percentage change in number of active participants, across all plans and years is -1.7%. Weighting the data by the number of active participants results in a slightly lower rate of decline, -1.3%.
Year-by-year averages of participant changes (across plans and weighted by participant) are shown in the following chart.
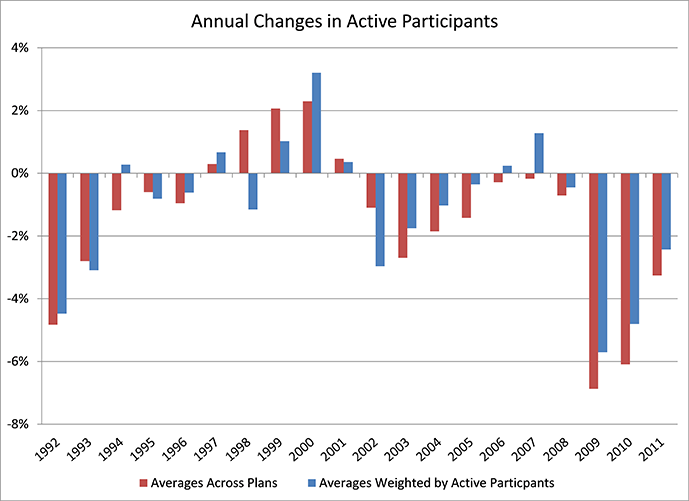
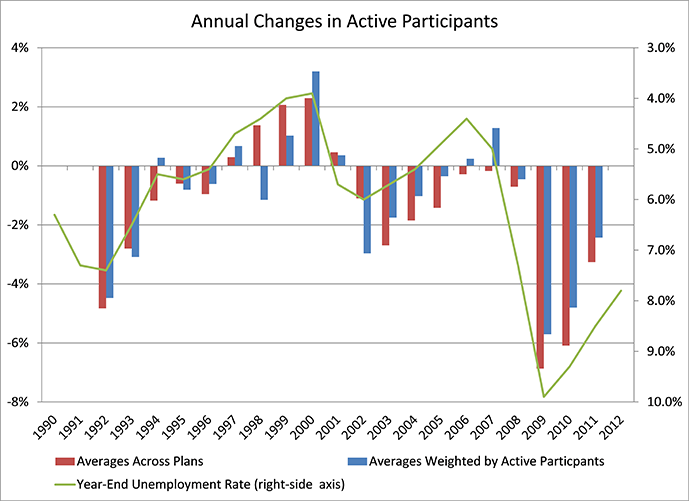
Declines in active populations have been more pronounced in the more recent years. For the first 10 years of data, covering 1992-2001, the weighted average annualized rate of decline is 0.7%. For the following 10 years, 2002-2011, the weighted average is 1.7%. One possible reason for the difference is that there may have been a general shift over time in willingness to sponsor multiemployer defined benefit plans. Another possibility is that larger economic factors have played a role in temporal changes to plan participation and those factors combined for a more negative influence in the second half of the data period. Supporting evidence for the latter possibility is that the largest declines in participation are clustered near U.S. recession periods. An illustration supporting that possibility is found in the following chart, which adds a graph of U.S. unemployment rates to that of the annual participation declines.1
Regression analysis
The model parameters include the α and β from the equation,
∆ln(Nt) = α + βΔln(Nt-1) + εt,
(additional model parameters are estimated to characterize the distribution of the disturbance term, εt). Those two parameters imply a mean-reversion rate of participation change within the model. That rate is given by the ratio α/(1-β).2
The following table shows parameter estimates from several regression variations. The factors altered in the different variations are:
- Weighting – where weighting is indicated, observations are weighted by the number of active participants
- Time period – initial modeling was done with data covering the 2001-2011 period and the data was later expanded to add observations starting with 1992
- Adjustment for economy effects – as mentioned earlier, the full modeling includes parameters for estimated correlations between the disturbance term and annual realizations of stock returns and bond yields. Using those estimated correlations and the historic values of the financial market variables, estimates of the effects related to historic financial market events can be removed from the regression data.3
|
|
Intercept (α) |
Lag |
Mean Reversion Rate (α/(1-β) |
Mean Reversion Rate as Percentage |
|---|---|---|---|---|
|
1992-2011 |
-0.0172 |
0.2190 |
-0.0220 |
-2.2% |
|
1992-2011, weighted |
-0.0138 |
0.2666 |
-0.0188 |
-1.9% |
|
1992-2011, adjusted for economy effects |
-0.0165 |
0.2192 |
-0.0211 |
-2.1% |
|
1992-2011, weighted and adjusted for economy effects |
-0.0139 |
0.2645 |
-0.0188 |
-1.9% |
|
2001-2011 |
-0.0208 |
0.2294 |
-0.0270 |
-2.7% |
|
2001-2011, weighted |
-0.0160 |
0.3276 |
-0.0237 |
-2.3% |
|
2001-2011, adjusted for economy effects |
-0.0191 |
0.2305 |
-0.0248 |
-2.4% |
|
2001-2011, weighted and adjusted for economy effects |
-0.0140 |
0.3387 |
-0.0212 |
-2.1% |
|
t-statistics in parentheses |
||||
The parameter estimates from each of the regressions result in mean reversion rates of decline that exceed the average rate of decline over the historic period. This is because the rate of decline is (nonlinearly) derived from regression parameters rather than being a direct estimate. Adjustment of the intercept (α) parameter can provide a "trueing-up" to produce in a mean reversion rate equaling a given historic rate of decline.
ME-PIMS sensitivity to participation trend parameters
The follow table presents a comparison between the projected multiemployer program deficit from the 2012 Exposure Report and two alternative simulations that differ from the baseline only in the participant change parameters. The first alternative uses parameters from some initial regression estimates for the 2001-2011 time period without weighting or adjustment for economy effects. The second alternative uses a rescaling of the first alternative's intercept parameter that results in a -1.25% mean reversion rate. Within the range of parameters considered, these results imply an over $4 billion deterioration in the projected deficit for each 1% decline in the mean reversion rate (the results may vary with changes to other ME-PIMS inputs and assumptions).
|
|
Mean Reversion Rate as Percentage |
PV 2022 ME Deficit |
|---|---|---|
|
FY2012 Exposure Report |
0.00% |
($26.2) |
|
Initial parameter estimates for 2001-2011 |
-2.70% |
($38.1) |
|
Intercept from initial parameter estimates adjusted for -1.25% mean reversion rate |
-1.25% |
($31.8) |
Recommendations
The functional form used to characterize plan-level participant dynamics has desirable properties and is a good fit for ME-PIMS. That regression analysis on the plan-level data doesn't directly estimate system-wide trends provides an argument for calibrating the regression parameters to align with a more direct estimate of a system-wide trend. The apparent limitations of the current adjustments for economy effects argues for using the longer time period to estimate the trend of participation decline.
Intermediate (or baseline) assumption: for the above reasons, I propose using the parameters from the "1992-2011, weighted" regression and adjusting the intercept to obtain a mean reversion rate of participation decline of 1.3% (the weighted average percentage rate of decline over the same period). The intercept parameter would be adjusted from -0.0138 to -0.0096.
High-cost assumption: I propose using parameters from the shorter, more recent, time period. That is, the "2001-2011, weighted" regression parameters with an implied 2.3% mean reversion rate of decline. This assumption could be somewhat moderated by adjusting the intercept to obtain a mean reversion decline rate from the direct measurement over the time period, 1.7%.
Low-cost assumption: I propose returning to the prior assumption of a mean reversion rate of a level active population for the low-cost assumption. As an alternative, simple regression analysis on the relationship between the rate of participation decline and the unemployment rate suggests that a return to an unemployment rate of 5.5% (Social Security's long-run intermediate assumption) could result in an annual rate of participation decline of 0.6%.
|
|
Mean Reversion Rate as Percentage |
|---|---|
|
Intermediate |
-1.3% |
|
High-Cost |
-2.3 |
|
Low-Cost |
0.0% |
1 Note that the chart plots unemployment rate on the right-side axis, which has values arranged in the reverse of usual ordering. The reverse ordering allows for easier display of the correlations between movements in the different series.
2 An equation of the given form has a steady state value, s, such that s = α + βs. Solving that equation for s gives the value α/(1-β). Over time, the mean value of a variable following that process will tend toward the steady state value (that is the process will be mean reverting) if -1<β<1.
3 The current model may only be partially adjusting for economy-wide effects. The correlation in the disturbance terms only measures contemporaneous correlations. For example, it allows for stock market volatility in any given year to be correlated with participant volatility in the same give year. The model does not allow stock returns from one or more years earlier to be correlated with the current year's participant volatility. Consider however the 2008 stock market crash. Active participation appears to be relatively unaffected in that year, but the years immediately following appear to be strongly affected. Unfortunately, given the limited number of annual observations, expanding the adjustment to allow for delayed effects would tend to resulting in "over-fitting" of the model's parameters.